Creates customizable visualizations using ggplot2 for longitudinal data.
Supports dynamic axis scaling, optional grouping, faceting, and error visualization
with ribbons or error bars.
Usage
generate_plot(
  stats,
  x_var,
  y_var,
  group_var = NULL,
  error_type = "bar",
  jitter_width = 0.1,
  xlab = NULL,
  ylab = NULL,
  title = NULL,
  subtitle = NULL,
  caption = NULL,
  facet = NULL,
  color_palette = NULL,
  reference_lines = NULL,
  show_sample_sizes = FALSE,
  statistical_annotations = FALSE,
  use_boxplot = FALSE,
  ribbon_alpha = 0.2,
  ribbon_fill = NULL,
  bw_print = FALSE,
  sample_size_opts = list(),
  contrast_display = NULL,
  contrast_data = NULL
)
Arguments
- stats
A data frame containing the data to be plotted. Must include the columns specified in
x_var,y_var, and optionallygroup_var,bound_lower, andbound_upperfor error visualization.- x_var
A string specifying the column name for the x-axis variable.
- y_var
A string specifying the column name for the y-axis variable.
- group_var
A string specifying the column name for the grouping variable.
- error_type
A string specifying the error type. Use
"bar"for error bars or"band"for ribbons.- jitter_width
Numeric. Width of horizontal jitter for error bars when multiple groups are present. Only applies when error_type = "bar".
- xlab
A string for the x-axis label.
- ylab
A string for the y-axis label.
- title
A string for the plot title.
- subtitle
A string for the plot subtitle.
- caption
A string for the plot caption.
- facet
A list specifying faceting variables. Use
facet_xfor columns andfacet_yfor rows. Both are optional.- color_palette
Optional vector of colors to use. If NULL, default ggplot colors are used.
- reference_lines
List of reference line specifications. Each element should be a list with components: value, axis ("x" or "y"), color, linetype, size.
- show_sample_sizes
Logical. If TRUE, adds sample size annotations.
- statistical_annotations
Logical. If TRUE, adds p-values and significance.
- use_boxplot
Logical. If TRUE, renders actual boxplots instead of line graphs.
- ribbon_alpha
Numeric. Transparency level for ribbon/band error representations. Values from 0 (fully transparent) to 1 (fully opaque). Default is 0.2.
- ribbon_fill
Character. Custom fill color for ribbons. If NULL, uses group colors.
- bw_print
Logical. If TRUE, maps linetype and shape to group variable for black-and-white print compatibility. Default is FALSE.
- sample_size_opts
List. Options controlling the appearance and placement of sample size labels. Elements (all optional):
- position
Placement style: "point" (next to each data point, the default) or "table" (color-coded table below x-axis with one row per group).
- size
Font size in mm. Default 2.8.
- color
Label color (only for position = "point"). Default "grey40". Table mode uses group colors.
- alpha
Transparency, 0-1. Default 1.
- nudge_x
Horizontal offset from the point (only for position = "point"). Default is auto-calculated.
- nudge_y
Vertical offset from the point (only for position = "point"). Default 0.
- gap
Fraction of y-range between plot area and first table row (only for position = "table"). Default 0.10.
- row_height
Fraction of y-range between table rows (only for position = "table"). Default 0.05.
- label_size
Font size for group labels in the table (only for position = "table"). Defaults to size.
- label_offset
Horizontal offset for group labels (only for position = "table"). Default 0.08 for continuous x, 0.35 for categorical.
- contrast_display
Optional character string controlling whether and how pairwise contrast annotations are added to the plot. NULL (default) suppresses contrast display.
- contrast_data
Optional data frame of contrast results to annotate. When NULL (default) no contrasts are drawn.
Examples
library(ggplot2)
data <- data.frame(
x = rep(1:10, each = 2),
mean_value = c(1:10, 2:11),
group = rep(c("A", "B"), 10),
bound_lower = c(0.8 * (1:10), 1:10),
bound_upper = c(1.2 * (1:10), 2:11),
is_continuous = TRUE
)
# Create a plot with error bands
plot <- generate_plot(
stats = data,
x_var = "x",
y_var = "mean_value",
group_var = "group",
error_type = "band",
xlab = "Time",
ylab = "Measurement",
title = "Example Plot"
)
print(plot)
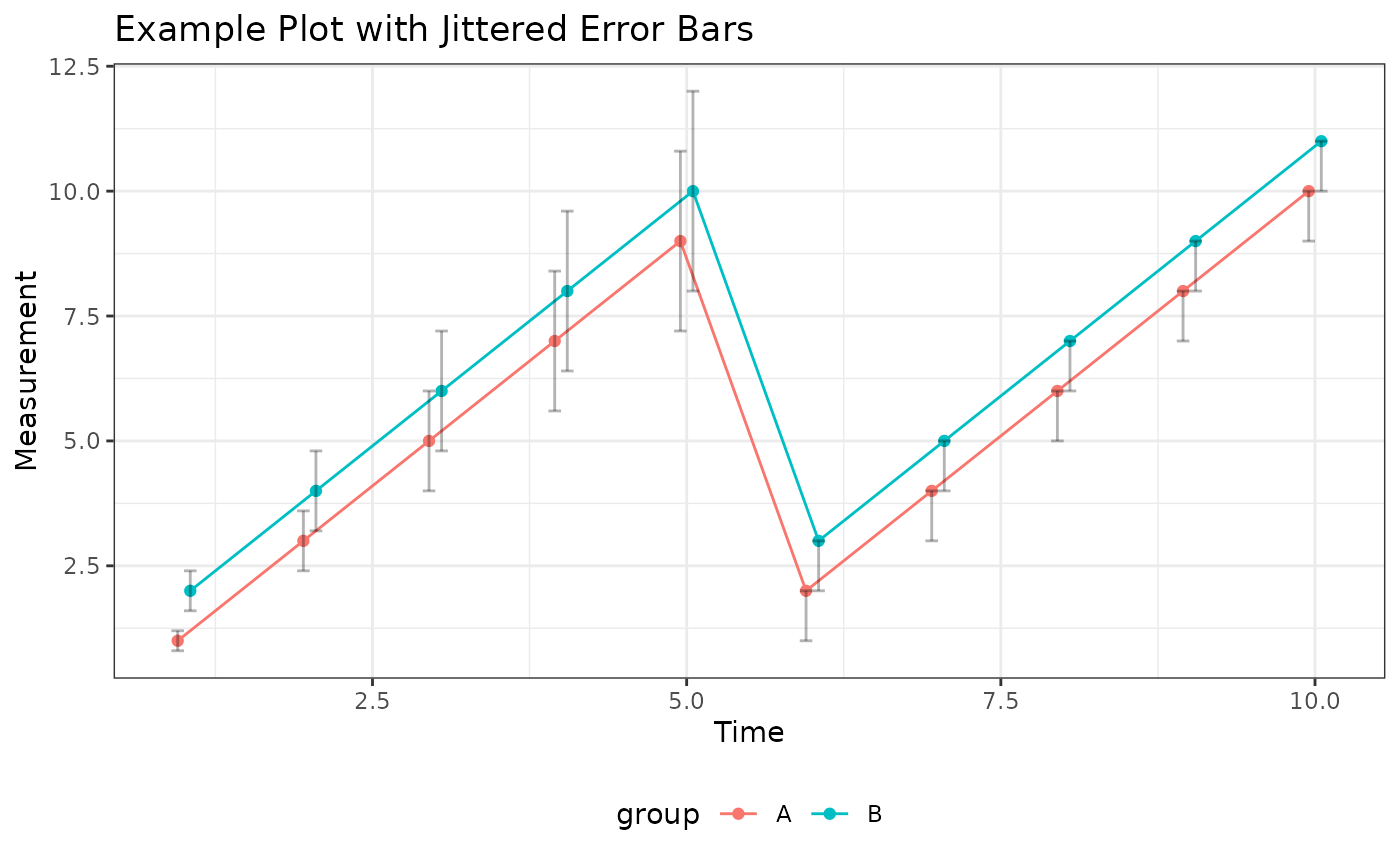
 # Create a plot with jittered error bars
plot_jitter <- generate_plot(
stats = data,
x_var = "x",
y_var = "mean_value",
group_var = "group",
error_type = "bar",
jitter_width = 0.2,
xlab = "Time",
ylab = "Measurement",
title = "Example Plot with Jittered Error Bars"
)
print(plot_jitter)
# Create a plot with jittered error bars
plot_jitter <- generate_plot(
stats = data,
x_var = "x",
y_var = "mean_value",
group_var = "group",
error_type = "bar",
jitter_width = 0.2,
xlab = "Time",
ylab = "Measurement",
title = "Example Plot with Jittered Error Bars"
)
print(plot_jitter)